| save / restore TRAS-settings | |
Some menu items described can also be activated directly by the symbols of the tool-bar.
 |
WinTR-AS manages all saved measured or
evaluated data in a DBase compatible database. All data is organized in projects
which are identified by a clear project (job) number.
Therefore
it’s necessary to select an existing project (job) or to create a new project
(job) if you want to save data into the database.
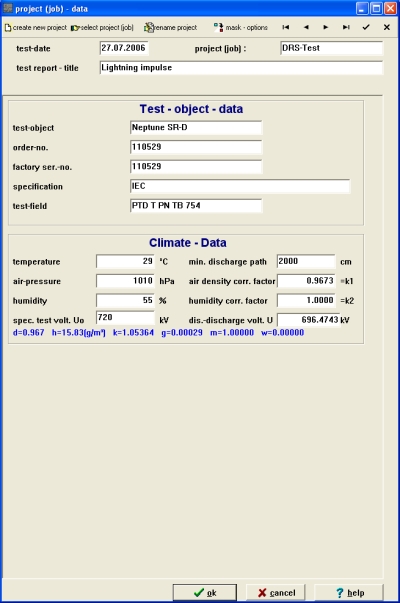
The actual menu item opens the following dialog „project (job) – data“.
You can use the buttons (database
navigator) on the left side below the dialog title to scan the database for
existing projects.
You will get a short help text (hint) about the function of the buttons if you
move the mouse cursor over one of these buttons.
After starting the WinTR-AS application the program selects the last worked
project (job).
 |
To create a new project (job), click to this
button. |
You are requested to input a new project name.
The
input field „project (job) No.“ is the key field for the database dataset.
The entry for the project (job) number has to be definitely and it’s not
allowed to enter only characters or characters mixed with numbers.
If you have made all inputs correctly you can click the „OK“-Button and the
new project (job) will be created in the database.
| To select a
existing project (job), click to this
button. |
You can select an existing project name
| To rename an existing project (job), click to this
button. |
You can rename an existing project name, e.g. if you did an incorrect input while creating a project
mask - options |
The button right besides the database navigator buttons is from special interest: |
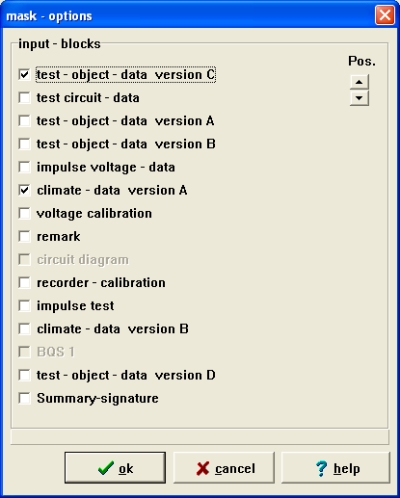 |
This
button opens an additional dialog where you can make settings regarding the
„project (job) – data“ dialog. You have the possibility to activate a
number of input masks, which you can select from a predefined set of masks. You
are also able to modify the sequence of the masks using the control „pos.“.
Please take note, that some settings exclude each other.
If you scroll through the projects you can edit all displayed data if you like,
except the field „project (job) No“. If you try to edit this field, the
program asks you, if you would like to create a new project (job). In this case
the software checks if the new project (job) number you entered, already
exists.
New : summary-signature
protocol
- preview
- graphic
– layout
- print
resolution
- test-report
– language
- print
graphics on/off
- continuous
numbering of the wave shapes in the test-report
- color
/ black-white print
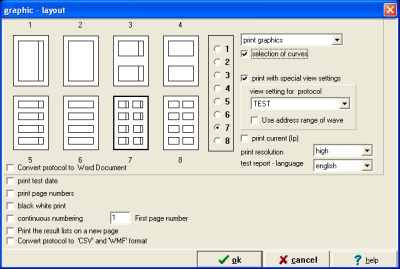 |
You
have the following choice for the picture layout:
1 = one picture per page with status window
2 = one picture per page without status window
3 = two pictures per page with status window
4 = two pictures per page without status window
5 = four pictures per page with status window
6 = four pictures per page without status window
7 = eight pictures per page with status window
8 = eight pictures per page without status window
Furthermore you are able
to select :
- no graphics
- print graphics
- waterfall-diagram
If " no graphics " is selected,
then only measuring results will occur in test-report.
If " print graphics " is selected then the curves stored with
measuring results will be printed as individual diagrams.
If "waterfall diagram" is choosen in drop-down list, then
the selected number of curves is printed into one diagram. "Waterfall
diagram" represents the display of several curves with an offset in x -
and y – direction. This kind of representing was developed for the graphic
evaluation of several curves. In the wasserfall - diagram there can be
importantly more easily identified deviations in one impulse in correspond
to a series of measurements.
You have the possibility to deselect the page numbers in the print out.
You could select a specially view settings for print out the protocol. Makes this settings with the graphic functions.
A
test-report will be generated from the project (job) data and displayed on the
screen. It depends on the quantity of the stored data how long it takes to
create the test-report preview (a lot of data can take some minutes !).
After all you have the possibility to save a completed test-report preview as
well and reload it later if you need it.
With the navigator buttons on the upper left side you are able to set several
zoom views or to leaf through the pages of the test-report.
If the preview shows the correct test-report layout you have the possibility to
print the actual test-report. You will also get hints if you move the mouse
cursor on a button and wait a few seconds.
New :
- print with special view settings
You can select a prepared view settings file for printing all
waveshapes for the test-report. For advanced printouts you can also
select a address range for all waveshapes
- Convert protocol to MS-Word document (this is a addon-program and needs special licensing)
- print of test-date
- waterfall graphics in test-report
- standard-graphics & waterfall graphics as selection for each waveshape
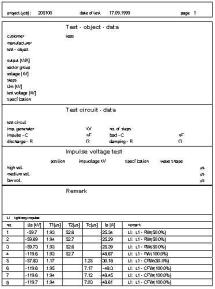 |
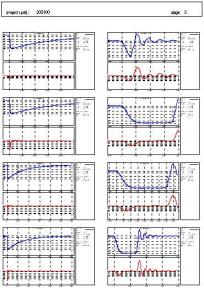 |
Example of a Test Report with several heads, table of results and measuring waves.
test
report - headline
It
is possible to create a bitmap including your company logo. With this menu item
you are able to choose a bitmap which will be placed to the top of your
test-report page. See our example „DRSLogo.BMP“ to get information about the
necessary size of the bitmap. If you do not choose any Bitmap, the test-report
page header will be empty.
| curves |
 |
Saving
and loading or measuring curves follows depending the selected application
according to the following table.
| Application | Save | Load |
| Standard | Main-zoom
interval of the selected display view |
Saved interval |
| Transforma |
Setup main interval | Saved interval |
| Calibration | Main-zoom
interval of the selected display view |
Saved interval |
| Divider calibration | Main-zoom
interval of the selected display view | Saved interval |
| Frequency Response Analysis | Main-zoom
interval of the selected display view | Saved interval |
| Calibrator calibration | Main-zoom
interval of the selected display view | Saved interval |
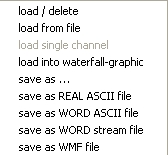
curves – load / delete
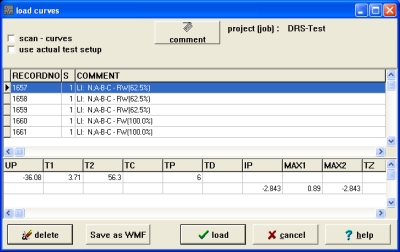 |
You will get a browser dialog where all saved
curves in the actual project (job) are listed one below the other. You will see
two lists in this dialog. The upper list shows all saved curves and the lower
list shows the corresponding evaluation results of the highlighted curve.
The
names of the list columns are the same as the names used in the
database tables. The display form was used for better orientation
if
you
want to open the database in another dBase-compatible program for
view purposes. Please never edit or save main-database from WinTRAS
with external tools, especially in the WinTRAS-installation folder
(usually "Program Files\Dr.Strauss\WinTRAS\dbTables"). Always
create a backup of the database for data-analysis and edit this.
If you activate the check-box „scan – curves“ the curves will be
automatically loaded and displayed in the background when you scroll through the
list of curves using the cursor control keys of the keyboard or by selecting one via mouse.
It is possible to reduce the size of the dialog for better view of the curve
window. In that function there is one big difference to the other modal
dialogues which a fixed size!
Scan-curves
is good function for getting a fast overview about saved waveshapes and
is well suited for selecting curves which can be deleted
NEW :
- Selection of multiple curves by holding STRG (CTRL)-button and selecting with mouse
- Editable comments (also done in autobackup-database, if this is enabled)
curves - load from file
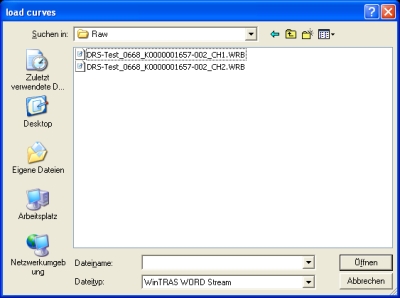 |
A
click on this menu item opens a load dialog for DOS-TRAS curves, ASCII curves
and IEC-TDG curves.
- Up
one level
- Create
new folder
- File
list without details
- File
list with details
If you want to load a curve with the file type ASCII or IEC-TDG you have to make additional settings in a further dialog listed below:
-
Destination channel
- Sample
interval
- Measure
range in Volt
- Offset
in percent (Zero-line of the curve)
curves
- save
The
actual displayed curves will be saved with their display view settings under the
selected project (job) into the database.
- save as REAL ASCII file
- save as binary WORD ASCII file
- save as binary WORD stream file
- save as WMF file
Pay
attention that hereby always the complete data interval of the recorder is saved
independently to the display interval shown on the screen.
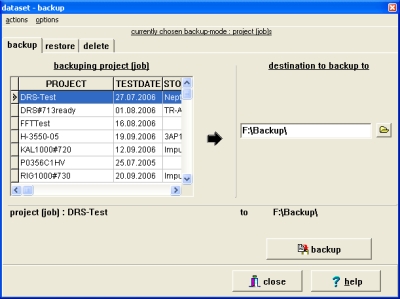
Backup-functions
opens a dialog with multiple register pages. Each page offers controls for one
of the following operations:
 |
Before you start working with this dialog we recommend to check the settings in the options menu!
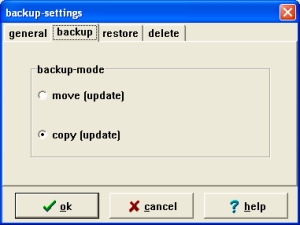 |
If
you select the „options“ menu item you will get a further multiple register
dialog where you can make settings for each operation.
Please read all options attentively and make
your choice.
With
modus move the project in the database is deleted while with modus copy the
project remains unchanged.
backup
of a project in database
If
you want to make a backup of project (job) do as follows:
- Select „projects“ in the field „backup-mode“.
- Click in the selection list named „source“ to the project (job)
number you would like to save. Multiple selection is
possible
pressing the control key.
- Click the button „backup“ when you have made all settings
correctly.
backup actual project in folder
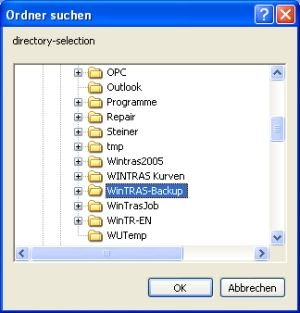 |
Select
the destination drive and destination folder on the right side of the dialog.
You have to make a double click to the destination folder for proper selection!
The folder will be displayed open!
restore project in database
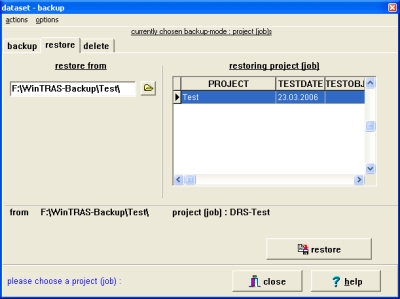 |
Under
restore from you must select the respective folder and select the
project. Multiple selection is possible pressing the control key.
Restore overwrites the respective project in the database.
delete
project in database
Check
settings of options for delete function before start with delete.
You can choose if additionally the project in the auto-backup database will be
deleted.
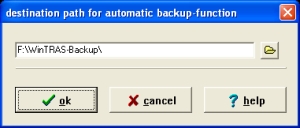 |
In
the selected folder all test results are stored additionally in this
backup-database.
Selection can be done under Options/ test report settings / path for
auto-backup. In case of problems with the origin database restoration can be
performed from this backup-database.
In case the measuring system is connected to a network, the auto-backup path can
be set to the respective server.
In case this path is set to the local harddisk you must consider this while
maintenance of your harddisk. Projects no longer needed should be deleted with
help of the backup-functions.
You have to make a double click to the destination folder for proper selection!
The folder will be displayed open!
Starts a print of the actual displayed curves including the status window. Please take note to make correct printer setup for optimal performance. You also can start a print job using the hotkey ALT + P.
printer
- setup
This
menu item opens the printer setup dialog as it is known under Windows 95. You
have the possibility to make settings for paper format, printer resolution etc.
Additional settings can be made using the button „Properties“.
With
this menu item you quit the WinTR-AS application. You receive a confirmation
question when you terminate the application with this menu item.
Attention:
If you started WinTR-AS with an OLE-client application you should also terminate
WinTR-AS using this Client!